Plotting Examples
The underlying starlink-pyast library has a rich functionality for handling plotting on multiple world coordinate systems. The interface is extensible and provides hooks for custom plot interfaces.
Plotting support in Cornish is not complete, but more than sufficient for checks like verifying regions.
Matplotlib Interface
starlink-pyast provides a wrapper for plotting with Matplotlib. Cornish goes further by creating routines that overlay these to interact with the Cornish objects in as simple a manner as possible. The primary interface is the SkyPlot object.
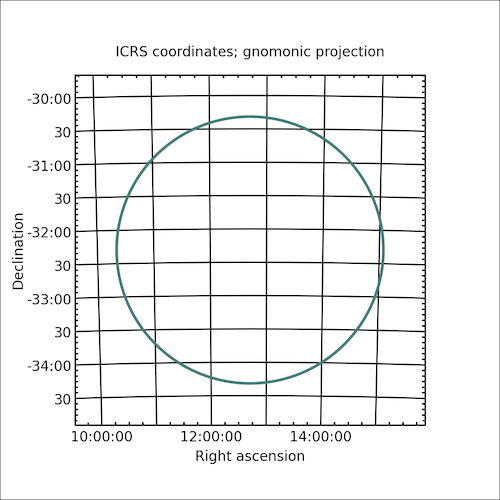
The following is a very simple example of how to plot a circle in an ICRS frame on the sky:
from cornish import ASTCircle
from cornish.plot.matplotlib import SkyPlot
import astropy.units as u
from astropy.coordinates import SkyCoord

# define a circle in the ICRS frame (used by default)
center = SkyCoord(ra="12d42m22s", dec="-32d18m58s")
circle = ASTCircle(center=center, radius=2.0*u.deg)

# define a new plot of 5x5 inches
# set the extent of the plot to the size of a circle
# with 1.25 x the circle radius to leave some room
skyplot = SkyPlot(extent=circle*1.25, figsize=(5,5))

# add region to plot
skyplot.addRegionOutline(circle)

# display
skyplot.show()
The result is:
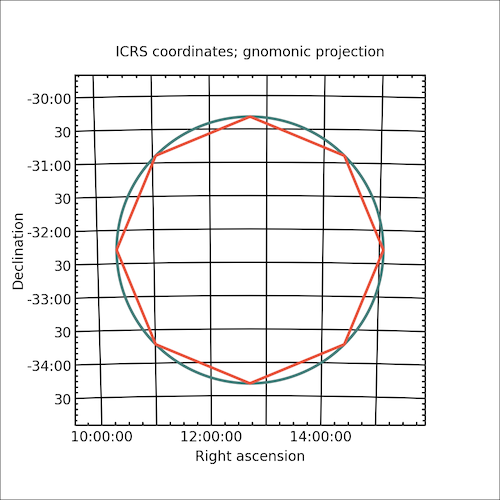
Repeat the same with a polygon converted from the circle.
from cornish import ASTCircle
from cornish.plot.matplotlib import SkyPlot
import astropy.units as u
from astropy.coordinates import SkyCoord

# define a circle in the ICRS frame (used by default)
center = SkyCoord(ra="12d42m22s", dec="-32d18m58s")
circle = ASTCircle(center=center, radius=2.0*u.deg)

# define a new plot of 5x5 inches
# set the extent of the plot to the size of a circle
# with 1.25 x the circle radius to leave some room
skyplot = SkyPlot(extent=circle*1.25, figsize=(5,5))

# add region to plot
skyplot.addRegionOutline(circle)
skyplot.addRegionOutline(circle.toPolygon(npoints=8), color="#3b85f7")

# display
skyplot.show()
The result is:
Todo
Link to Trillian docs to demonstrate plotting via the Trillian API.
Other Interfaces
Currently only the Matplotlib interface is supported. More are planned.